Over the past nearly four decades, we have seen a significant pullback in healthcare stocks during three distinct periods: early 2003, following the bursting of the tech bubble, 2015-16, driven by political rhetoric and pricing pressure fears, and now. The earlier periods were followed by a bull market for healthcare stocks and we see today as another active entry point into a sector that we feel is strongly dislocated from its fundamentals.

Sentiment right now is on its knees, as you can see here from ETF outflows that have been extreme for a while now. Any turn in relative performance should be followed by a boost in sector flows. We see these flow charts as interesting in their own right, particularly as a powerful contrarian indicator.

ETF flows a powerful contrary indicator
Etf Flows A Powerful Contrary Indicator
Source: Strategas ETF Research, Bloomberg, 01 May 2025. RSPH US Equity (Invesco S&P 500 Equal Weight Health Care ETF) HC 250d Flows, daily 31 December 2012 - 01 May 2025.

To us, healthcare stocks are attractively priced. There are obvious headwinds for the sector – US policy risk being one of them – but we could soon reach or already be at ‘peak fear’. Importantly, there are powerful tailwinds, including a vast array of new product launches across various sectors such as medical devices and pharmaceuticals. Long-term growth drivers are also very much intact with consolidation, prevention and emerging markets prime examples. The medium and long-term investment opportunity for healthcare, we believe, is compelling.

How did we get here – if ‘here’ is the challenge of being bottom decile when looking at a rolling five-year performance? Most immediately it has been through a combination of Donald Trump, Robert F Kennedy Jr, and Elon Musk creating huge uncertainty, not just in healthcare but across many other markets which seemed to catch everyone by surprise.

Relative performance trend signals a ‘buy’ for the sector
Relative Performance Trend Signals A ‘Buy’ For The Sector
Source: Strategas Technical & Macro Research, Bloomberg, 01 May 2025. S5HLTH Index (S&P 500 Health Care Sector GICS Level 1 Index) HC vs SPX 3YR, Weekly 31 December 1994 - 01 May 2025.

There is a mea culpa here because as we headed into this year, we thought a Republican trifecta would be broadly positive for healthcare and we certainly did not expect the levels of volatility we have seen. However, it is important to note in the absence of Congressional support and changes in legislation, we think that widespread draconian changes to healthcare are probably unlikely.

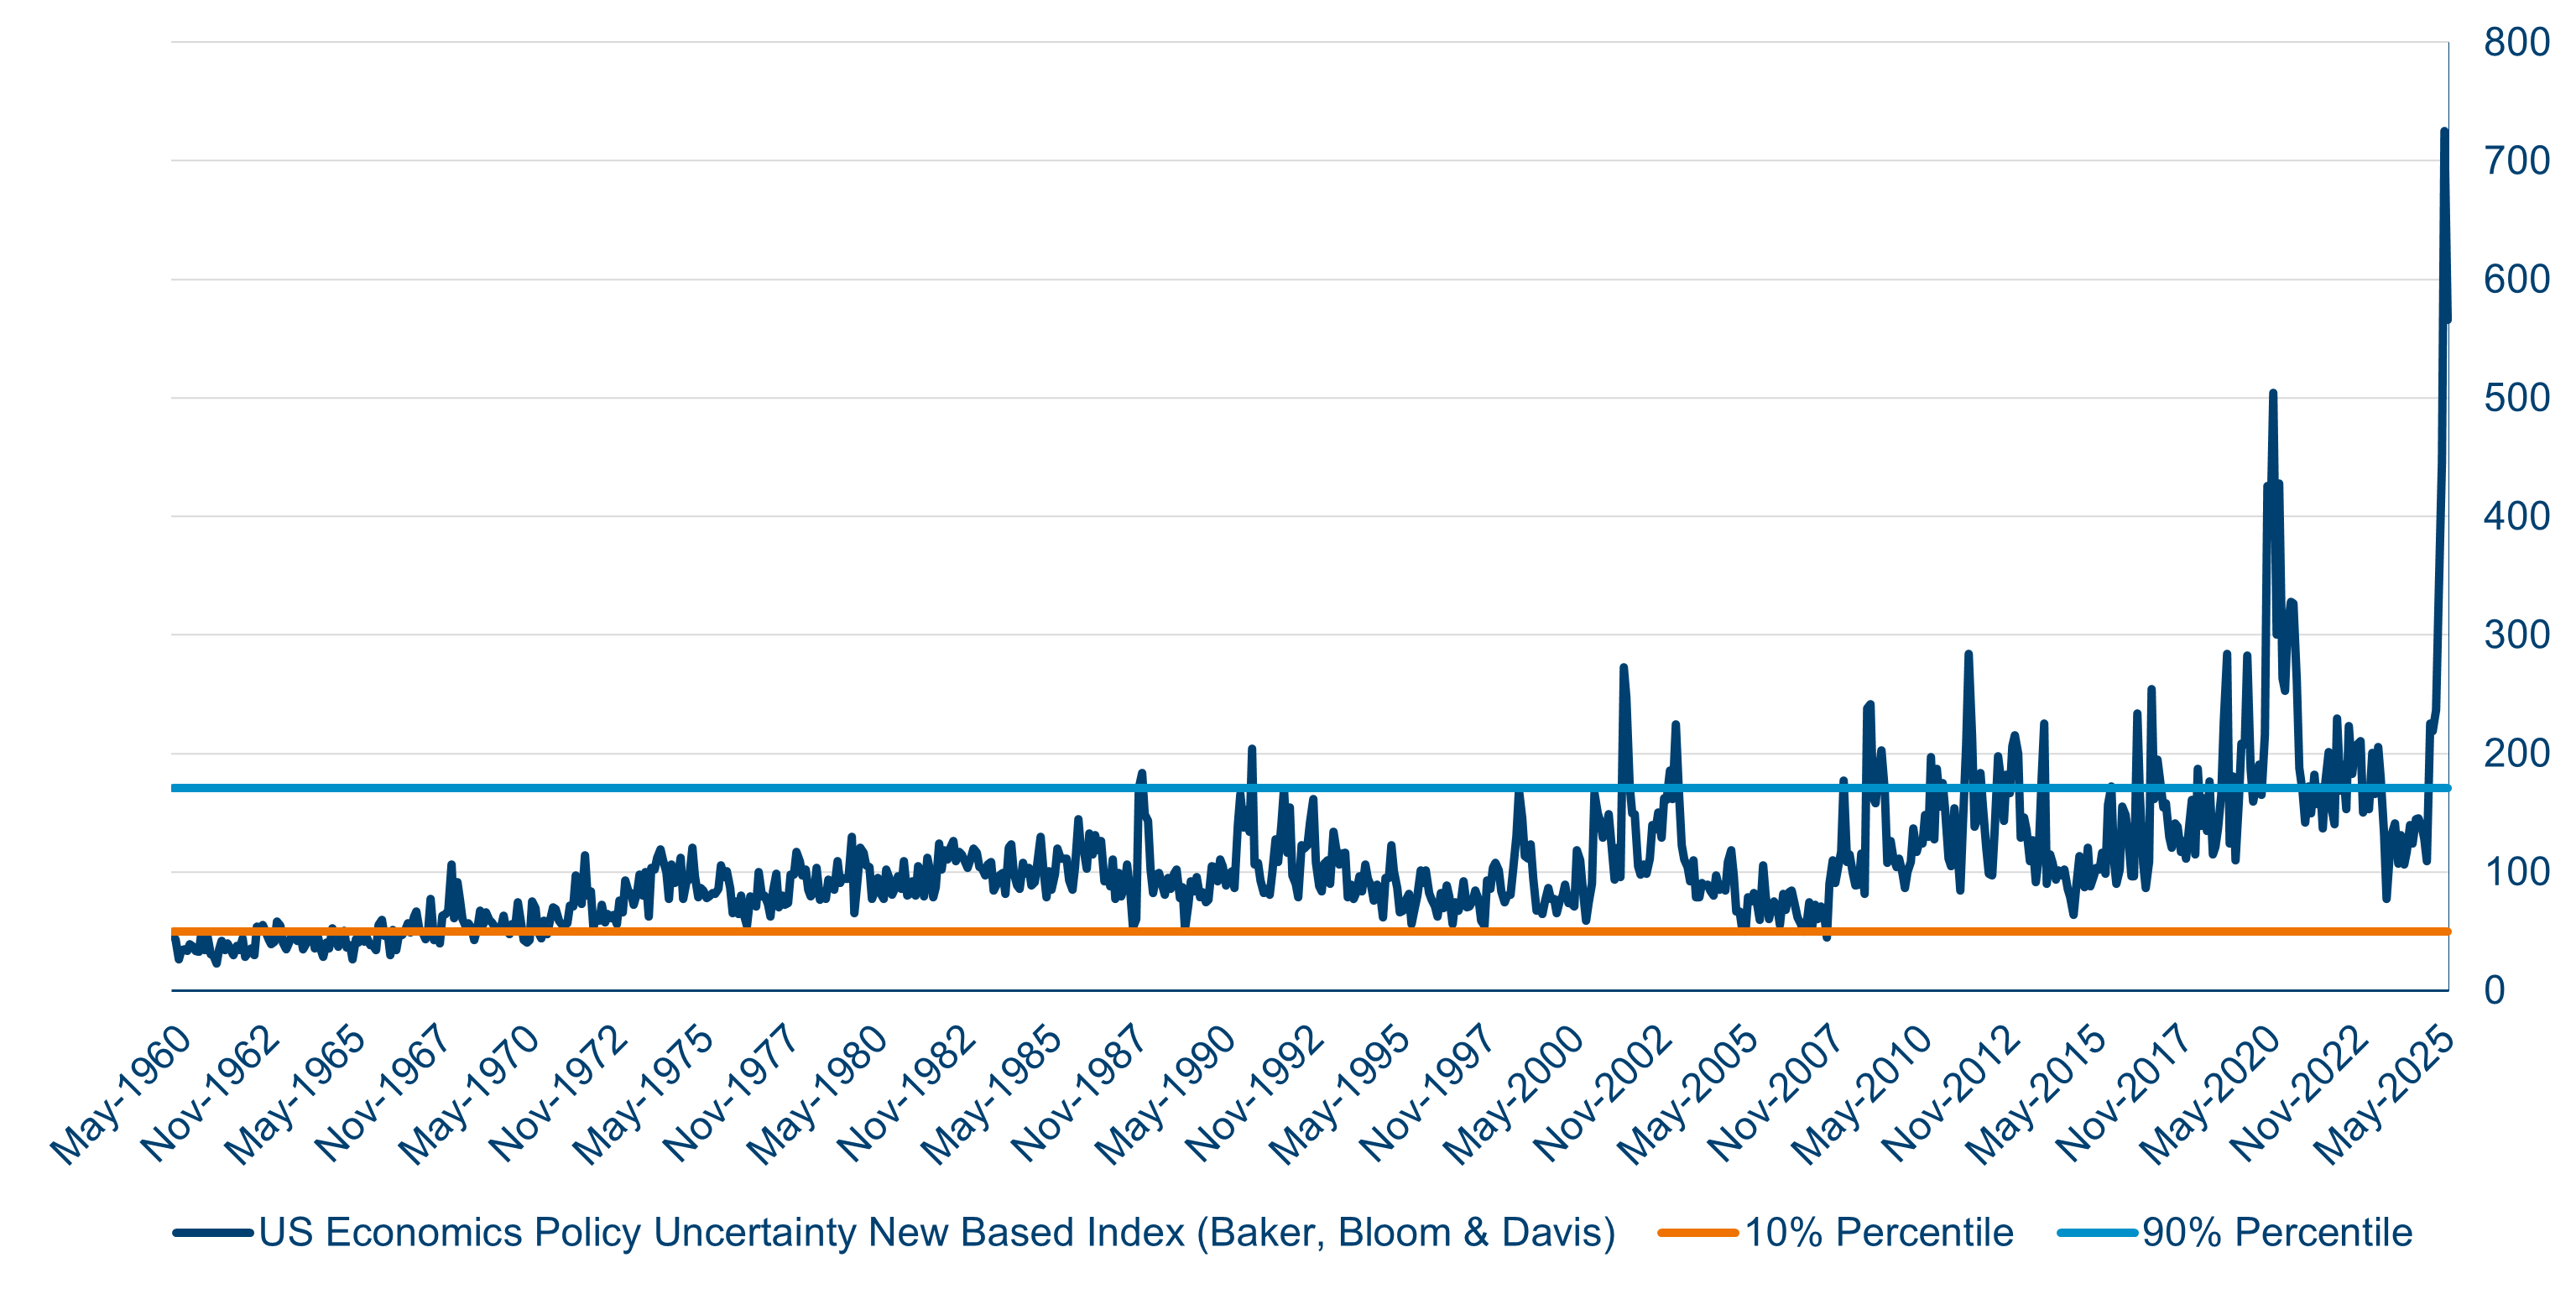
There is a correlation in the relationship between returns and policy fears which, looking at the chart below, shows it can be rewarding when you invest above the green line. The dramatic spike showing the selloff in late 2024 encourages our argument that policy fear is reaching some sort of peak, meaning the return profile from here could be attractive.

Invest when policy uncertainty is at its highest
Source: US monthly Economic Policy Uncertainty (EPU) Index; https://www.policyuncertainty.com/us_monthly.html. 31 May 2025.

We also do detailed technical analysis. The chart below looks at the relative performance of the S&P 500 Health Care Index versus the S&P 500. It shows that every seven or eight years, we have a cycle where we get this technical support and the sector does well. For example, in the early 1990s, there were concerns that Hillary Clinton would introduce reform. She failed. The sector recovered. In the early 2010s, Barack Obama introduced The Affordable Care Act – Obamacare – but once we had visibility on the investment landscape, the sector recovered.

S&P 500 Healthcare Index vs S&P 500 Index

S&P 500 Healthcare Index Vs S&P 500 Index
Source: Polar Capital, Bloomberg as at 30 April 2025.

Looking at the far right-hand side of the graph, you can see we are roughly at that support level so, if the fundamentals remain intact and we see some of these transient headwinds, we believe that now could be an important inflection point for the sector on a relative basis.

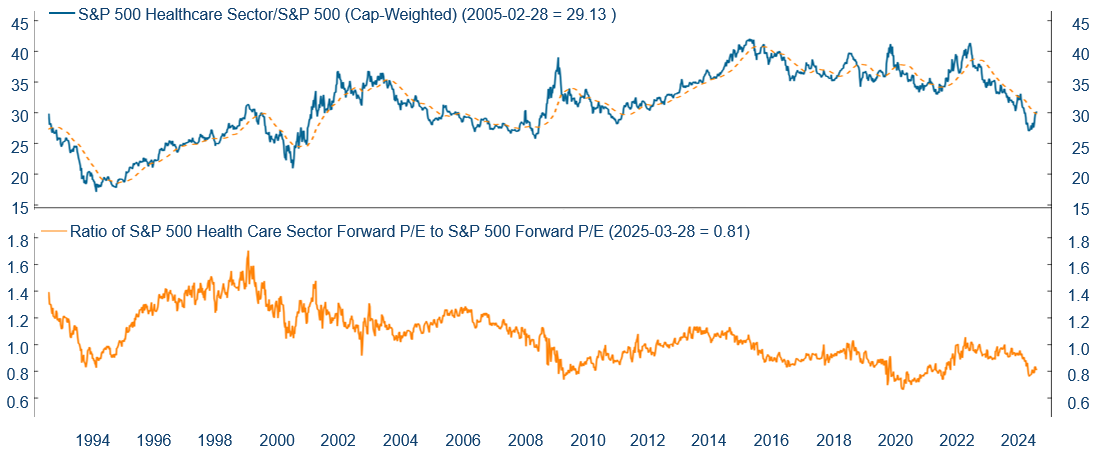
Valuations (price to earnings) show the healthcare sector is at a c20% discount so, in absolute terms is fairly attractive and in relative terms is very attractive. We believe that as long as the sector can deliver earnings growth, it should do reasonably well from here – valuations should not be a reason not to engage.

S&P 500 healthcare sector relative forward price to earnings (P/E) ratio

S&P 500 Healthcare Sector Relative Forward Price To Earnings Pe Ratio
Source: Ned Davis Research Inc., 03 January 1992 to 25 April 2025. Sector earnings estimate calculated by NDR using available mean 1-year forward earnings estimates for sector constituents. Copyright 2024 Ned Davis Research, Inc. Further distribution prohibited without prior permission. All Rights Reserved. See NDR Disclaimer at www.ndr.com/copyright.html.

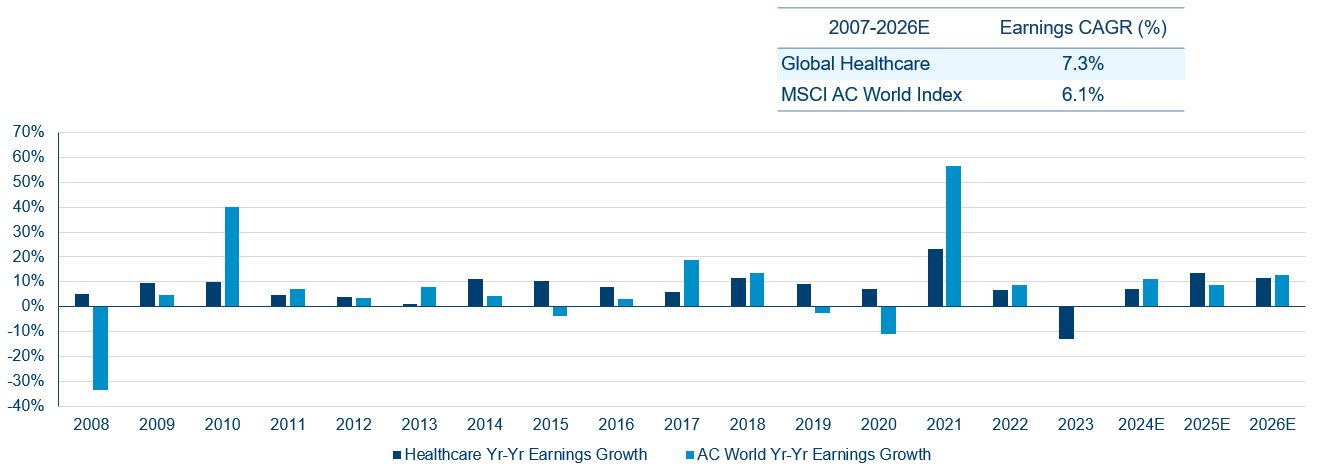
Finally, the chart below looks at two things, an absolute level of growth and the consistency of growth. The dark blue bars look at year-on-year earnings growth that has been very consistent for the healthcare sector. We did have some exceptions – in 2021 and 2023, primarily driven by COVID, as the market and the world thankfully realised it does not need so many vaccines or tests or manufacturing. We think the underlying picture is robust. If you look at the estimates for 2025, the data points to a sector that delivers slightly better earnings.

Large-cap healthcare has a record of superior growth
The lower earnings volatility is underpinned by long-term secular growth drivers

Large Cap Healthcare Has A Record Of Superior Growth
Source: Citi Research, 30 April 2025. 

The key drivers for our sector remain in place.

  • Delivery disruption is something we talk about consistently, the idea of being able to treat a patient away from a hospital using technology. We think that is going to be an important and durable growth driver.
  • We think the healthcare sector is also very innovative, not just in pharmaceuticals but with medical devices too.
  • The sector has strong balance sheets and is highly fragmented – two of the main ingredients for consolidation. Companies are often agnostic to the source of innovation or R&D, so are looking for external assets as well as internal developments. We think you will continue to see consolidation. 
  • Emerging markets are an incredibly important driver of growth as well. It is extremely heterogeneous, but the underlying theme of a growing, ageing population with greater healthcare demands is consistent.
  • Outsourcing will probably continue. Companies will stick to their knitting, outsourcing non-core activities such as manufacturing.
  • Prevention, i.e. not just vaccines, but also diagnostics. Can we diagnose a patient? Can we put them on the right treatment path? Can we drive better outcomes?

We think all these long-term drivers are still intact, underpinning the idea that healthcare is a durable long-term growth sector.

Outlook

We think healthcare is bruised but not broken. The sector may be heavily out of favour but, for the most part, fundamentals are intact and we need to navigate through a few near-term transient headwinds.

The demand for therapeutics, medical devices, technology and services continues to be strong. The industry is investing in R&D, it is innovating and developing much-needed solutions for complex problems. The political, regulatory and macro-insurgencies have contracted valuations, but for us that is simply creating really exciting medium and long-term investment opportunities.

To our mind, key secular drivers of sustainable growth remain firmly intact and indeed some may be even accelerating. Conviction that healthcare is a compelling medium and long-term opportunity set is high and we will certainly be looking to take advantage of the widespread apprehension we are seeing today.

Risks

  • Capital is at risk and there is no guarantee the Fund will achieve its objective. Investors should make sure their attitude towards risk is aligned with the risk profile of the Fund before investing.
  • Past performance is not a reliable guide to future performance. The value of investments may go down as well as up and you might get back less than you originally invested as there is no guarantee in place.
  • The value of a fund’s assets may be affected by uncertainties such as international political developments, market sentiment, economic conditions, changes in government policies, restrictions on foreign investment and currency repatriation, currency fluctuations and other developments in the laws and regulations of countries in which investment may be made. Please see the Fund’s Prospectus for details of all risks.
  • The Fund invests in the shares of companies and share prices can rise or fall due to several factors affecting global stock markets.
  • The Fund uses derivatives which carry the risk of reduced liquidity, substantial loss and increased volatility in adverse market conditions, such as failure amongst market participants.
  • The Fund invests in assets denominated in currencies other than the Fund's base currency. Changes in exchange rates may have a negative impact on the Fund's investments. If the share class currency is different from the currency of the country in which you reside, exchange rate fluctuations may affect your returns when converted into your local currency. Hedged share classes may have associated costs which may impact the performance of your investment.
  • The Fund invests in a relatively concentrated number of companies and industries based in one sector. This focused strategy can produce high gains but can also lead to significant losses. The Fund may be less diversified than other investment funds.


Important Information:
This is a marketing communication and does not constitute a solicitation or offer to any person to buy or sell any related securities or financial instruments. Any opinions expressed may change. This document does not contain information material to the investment objectives or financial needs of the recipient. This document is not advice on legal, taxation or investment matters. Tax treatment depends on personal circumstances. Investors must rely on their own examination of the fund or seek advice. Investment may be restricted in other countries and as such, any individual who receives this document must make themselves aware of their respective jurisdiction and observe any restrictions.

A decision may be taken at any time to terminate the marketing of the Fund in any EEA Member State in which it is currently marketed. Shareholders in the affected EEA Member State will be given notification of any decision and provided the opportunity to redeem their interests in the Fund, free of any charges or deductions, for at least 30 working days from the date of the notification.

Investment in the Fund is an investment in the shares of the Fund and not in the underlying investments of the Fund. Further information about fund characteristics and any associated risks can be found in the Fund’s Key Information Document or Key Investor Information Document (“KID” or “KIID”), the Prospectus (and relevant Fund Supplement), the Articles of Association and the Annual and Semi-Annual Reports. Please refer to these documents before making any final investment decisions. These documents are available free of charge at Polar Capital Funds plc, Georges Court, 54-62 Townsend Street, Dublin 2, Ireland, via email by contacting Investor-Relations@polarcapitalfunds.com or at www.polarcapital.co.uk. The KID is available in the languages of all EEA member states in which the Fund is registered for sale; the Prospectus, Annual and Semi-Annual Reports and KIID are available in English.

The Fund promotes, among other characteristics, environmental or social characteristics and is classified as an Article 8 fund under the EU's Sustainable Finance Disclosure Regulation (SFDR). For more information, please see the Prospectus and relevant Fund Supplement.

ESG and sustainability characteristics are further detailed on the investment manager’s website: - https://www.polarcapital.co.uk/ESG-and-Sustainability/Responsible-Investing/.

A summary of investor rights associated with investment in the Fund can be found here.

This document is provided and approved by both Polar Capital LLP and Polar Capital (Europe) SAS.

Polar Capital LLP is authorised and regulated by the Financial Conduct Authority (“FCA”) in the United Kingdom, and the Securities and Exchange Commission (“SEC”) in the United States. Polar Capital LLP’s registered address is 16 Palace Street, London, SW1E 5JD, United Kingdom.

Polar Capital (Europe) SAS is authorised and regulated by the Autorité des marchés financiers (AMF) in France. Polar Capital (Europe) SAS’s registered address is 18 Rue de Londres, Paris 75009, France.

Polar Capital LLP is a registered Investment Advisor with the SEC. Polar Capital LLP is the investment manager and promoter of Polar Capital Funds plc – an open-ended investment company with variable capital and with segregated liability between its sub-funds – incorporated in Ireland, authorised by the Central Bank of Ireland and recognised by the FCA. Bridge Fund Management Limited acts as management company and is regulated by the Central Bank of Ireland. Registered Address: Percy Exchange, 8/34 Percy Place, Dublin 4, Ireland.

For UK investors: The Fund is recognised in the UK under the Overseas Funds Regime (OFR) but it is not a UK-authorised Fund. UK investors should be aware that they may not be able to refer a complaint against its Management Company or its Depositary to the UK’s Financial Ombudsman Service. Any claims for losses relating to the Management Company or the Depositary will not be covered by the Financial Services Compensation Scheme, in the event that either entity should become unable to meet its liabilities to investors. For information on the complaint process to the Management Company, please see the Country Supplement for this fund available at https://www.polarcapital.co.uk/.

Benchmark: The Fund is actively managed and uses the MSCI AC World Daily Total Return Net Health Care Index as a performance target and to calculate the performance fee. The benchmark has been chosen as it is generally considered to be representative of the investment universe in which the Fund invests. The performance of the Fund is likely to differ from the performance of the benchmark as the holdings, weightings and asset allocation will be different. Investors should carefully consider these differences when making comparisons. Further information about the benchmark can be found here. The benchmark is provided by an administrator on the European Securities and Markets Authority (ESMA) register of benchmarks which includes details of all authorised, registered, recognised and endorsed EU and third country benchmark administrators together with their national competent authorities.

Third-party Data: Some information contained herein has been obtained from third party sources and has not been independently verified by Polar Capital. Neither Polar Capital nor any other party involved in or related to compiling, computing or creating the data makes any express or implied warranties or representations with respect to such data (or the results to be obtained by the use thereof), and all such parties hereby expressly disclaim all warranties of originality, accuracy, completeness, merchantability or fitness for a particular purpose with respect to any data contained herein.

Country Specific Disclaimers: Please be aware that not every share class of every fund is available in all jurisdictions. When considering an investment into the Fund, you should make yourself aware of the relevant financial, legal and tax implications. Neither Polar Capital LLP nor Polar Capital Funds plc shall be liable for, and accept no liability for, the use or misuse of this document.

None

Over the past nearly four decades, we have seen a significant pullback in healthcare stocks during three distinct periods: early 2003, following the bursting of the tech bubble, 2015-16, driven by political rhetoric and pricing pressure fears, and now. The earlier periods were followed by a bull market for healthcare stocks and we see today as another active entry point into a sector that we feel is strongly dislocated from its fundamentals.

Sentiment right now is on its knees, as you can see here from ETF outflows that have been extreme for a while now. Any turn in relative performance should be followed by a boost in sector flows. We see these flow charts as interesting in their own right, particularly as a powerful contrarian indicator.

ETF flows a powerful contrary indicator
Etf Flows A Powerful Contrary Indicator
Source: Strategas ETF Research, Bloomberg, 01 May 2025. RSPH US Equity (Invesco S&P 500 Equal Weight Health Care ETF) HC 250d Flows, daily 31 December 2012 - 01 May 2025.

To us, healthcare stocks are attractively priced. There are obvious headwinds for the sector – US policy risk being one of them – but we could soon reach or already be at ‘peak fear’. Importantly, there are powerful tailwinds, including a vast array of new product launches across various sectors such as medical devices and pharmaceuticals. Long-term growth drivers are also very much intact with consolidation, prevention and emerging markets prime examples. The medium and long-term investment opportunity for healthcare, we believe, is compelling.

How did we get here – if ‘here’ is the challenge of being bottom decile when looking at a rolling five-year performance? Most immediately it has been through a combination of Donald Trump, Robert F Kennedy Jr, and Elon Musk creating huge uncertainty, not just in healthcare but across many other markets which seemed to catch everyone by surprise.

Relative performance trend signals a ‘buy’ for the sector
Relative Performance Trend Signals A ‘Buy’ For The Sector
Source: Strategas Technical & Macro Research, Bloomberg, 01 May 2025. S5HLTH Index (S&P 500 Health Care Sector GICS Level 1 Index) HC vs SPX 3YR, Weekly 31 December 1994 - 01 May 2025.

There is a mea culpa here because as we headed into this year, we thought a Republican trifecta would be broadly positive for healthcare and we certainly did not expect the levels of volatility we have seen. However, it is important to note in the absence of Congressional support and changes in legislation, we think that widespread draconian changes to healthcare are probably unlikely.

There is a correlation in the relationship between returns and policy fears which, looking at the chart below, shows it can be rewarding when you invest above the green line. The dramatic spike showing the selloff in late 2024 encourages our argument that policy fear is reaching some sort of peak, meaning the return profile from here could be attractive.

Invest when policy uncertainty is at its highest
Source: US monthly Economic Policy Uncertainty (EPU) Index; https://www.policyuncertainty.com/us_monthly.html. 31 May 2025.

We also do detailed technical analysis. The chart below looks at the relative performance of the S&P 500 Health Care Index versus the S&P 500. It shows that every seven or eight years, we have a cycle where we get this technical support and the sector does well. For example, in the early 1990s, there were concerns that Hillary Clinton would introduce reform. She failed. The sector recovered. In the early 2010s, Barack Obama introduced The Affordable Care Act – Obamacare – but once we had visibility on the investment landscape, the sector recovered.

S&P 500 Healthcare Index vs S&P 500 Index

S&P 500 Healthcare Index Vs S&P 500 Index
Source: Polar Capital, Bloomberg as at 30 April 2025.

Looking at the far right-hand side of the graph, you can see we are roughly at that support level so, if the fundamentals remain intact and we see some of these transient headwinds, we believe that now could be an important inflection point for the sector on a relative basis.

Valuations (price to earnings) show the healthcare sector is at a c20% discount so, in absolute terms is fairly attractive and in relative terms is very attractive. We believe that as long as the sector can deliver earnings growth, it should do reasonably well from here – valuations should not be a reason not to engage.

S&P 500 healthcare sector relative forward price to earnings (P/E) ratio

S&P 500 Healthcare Sector Relative Forward Price To Earnings Pe Ratio
Source: Ned Davis Research Inc., 03 January 1992 to 25 April 2025. Sector earnings estimate calculated by NDR using available mean 1-year forward earnings estimates for sector constituents. Copyright 2024 Ned Davis Research, Inc. Further distribution prohibited without prior permission. All Rights Reserved. See NDR Disclaimer at www.ndr.com/copyright.html.

Finally, the chart below looks at two things, an absolute level of growth and the consistency of growth. The dark blue bars look at year-on-year earnings growth that has been very consistent for the healthcare sector. We did have some exceptions – in 2021 and 2023, primarily driven by COVID, as the market and the world thankfully realised it does not need so many vaccines or tests or manufacturing. We think the underlying picture is robust. If you look at the estimates for 2025, the data points to a sector that delivers slightly better earnings.

Large-cap healthcare has a record of superior growth
The lower earnings volatility is underpinned by long-term secular growth drivers

Large Cap Healthcare Has A Record Of Superior Growth
Source: Citi Research, 30 April 2025. 

The key drivers for our sector remain in place.

  • Delivery disruption is something we talk about consistently, the idea of being able to treat a patient away from a hospital using technology. We think that is going to be an important and durable growth driver.
  • We think the healthcare sector is also very innovative, not just in pharmaceuticals but with medical devices too.
  • The sector has strong balance sheets and is highly fragmented – two of the main ingredients for consolidation. Companies are often agnostic to the source of innovation or R&D, so are looking for external assets as well as internal developments. We think you will continue to see consolidation. 
  • Emerging markets are an incredibly important driver of growth as well. It is extremely heterogeneous, but the underlying theme of a growing, ageing population with greater healthcare demands is consistent.
  • Outsourcing will probably continue. Companies will stick to their knitting, outsourcing non-core activities such as manufacturing.
  • Prevention, i.e. not just vaccines, but also diagnostics. Can we diagnose a patient? Can we put them on the right treatment path? Can we drive better outcomes?

We think all these long-term drivers are still intact, underpinning the idea that healthcare is a durable long-term growth sector.

Outlook

We think healthcare is bruised but not broken. The sector may be heavily out of favour but, for the most part, fundamentals are intact and we need to navigate through a few near-term transient headwinds.

The demand for therapeutics, medical devices, technology and services continues to be strong. The industry is investing in R&D, it is innovating and developing much-needed solutions for complex problems. The political, regulatory and macro-insurgencies have contracted valuations, but for us that is simply creating really exciting medium and long-term investment opportunities.

To our mind, key secular drivers of sustainable growth remain firmly intact and indeed some may be even accelerating. Conviction that healthcare is a compelling medium and long-term opportunity set is high and we will certainly be looking to take advantage of the widespread apprehension we are seeing today.

Risks

  • Capital is at risk and there is no guarantee the Fund will achieve its objective. Investors should make sure their attitude towards risk is aligned with the risk profile of the Fund before investing.
  • Past performance is not a reliable guide to future performance. The value of investments may go down as well as up and you might get back less than you originally invested as there is no guarantee in place.
  • The value of a fund’s assets may be affected by uncertainties such as international political developments, market sentiment, economic conditions, changes in government policies, restrictions on foreign investment and currency repatriation, currency fluctuations and other developments in the laws and regulations of countries in which investment may be made. Please see the Fund’s Prospectus for details of all risks.
  • The Fund invests in the shares of companies and share prices can rise or fall due to several factors affecting global stock markets.
  • The Fund uses derivatives which carry the risk of reduced liquidity, substantial loss and increased volatility in adverse market conditions, such as failure amongst market participants.
  • The Fund invests in assets denominated in currencies other than the Fund's base currency. Changes in exchange rates may have a negative impact on the Fund's investments. If the share class currency is different from the currency of the country in which you reside, exchange rate fluctuations may affect your returns when converted into your local currency. Hedged share classes may have associated costs which may impact the performance of your investment.
  • The Fund invests in a relatively concentrated number of companies and industries based in one sector. This focused strategy can produce high gains but can also lead to significant losses. The Fund may be less diversified than other investment funds.


Important Information:
This is a marketing communication and does not constitute a solicitation or offer to any person to buy or sell any related securities or financial instruments. Any opinions expressed may change. This document does not contain information material to the investment objectives or financial needs of the recipient. This document is not advice on legal, taxation or investment matters. Tax treatment depends on personal circumstances. Investors must rely on their own examination of the fund or seek advice. Investment may be restricted in other countries and as such, any individual who receives this document must make themselves aware of their respective jurisdiction and observe any restrictions.

A decision may be taken at any time to terminate the marketing of the Fund in any EEA Member State in which it is currently marketed. Shareholders in the affected EEA Member State will be given notification of any decision and provided the opportunity to redeem their interests in the Fund, free of any charges or deductions, for at least 30 working days from the date of the notification.

Investment in the Fund is an investment in the shares of the Fund and not in the underlying investments of the Fund. Further information about fund characteristics and any associated risks can be found in the Fund’s Key Information Document or Key Investor Information Document (“KID” or “KIID”), the Prospectus (and relevant Fund Supplement), the Articles of Association and the Annual and Semi-Annual Reports. Please refer to these documents before making any final investment decisions. These documents are available free of charge at Polar Capital Funds plc, Georges Court, 54-62 Townsend Street, Dublin 2, Ireland, via email by contacting Investor-Relations@polarcapitalfunds.com or at www.polarcapital.co.uk. The KID is available in the languages of all EEA member states in which the Fund is registered for sale; the Prospectus, Annual and Semi-Annual Reports and KIID are available in English.

The Fund promotes, among other characteristics, environmental or social characteristics and is classified as an Article 8 fund under the EU's Sustainable Finance Disclosure Regulation (SFDR). For more information, please see the Prospectus and relevant Fund Supplement.

ESG and sustainability characteristics are further detailed on the investment manager’s website: - https://www.polarcapital.co.uk/ESG-and-Sustainability/Responsible-Investing/.

A summary of investor rights associated with investment in the Fund can be found here.

This document is provided and approved by both Polar Capital LLP and Polar Capital (Europe) SAS.

Polar Capital LLP is authorised and regulated by the Financial Conduct Authority (“FCA”) in the United Kingdom, and the Securities and Exchange Commission (“SEC”) in the United States. Polar Capital LLP’s registered address is 16 Palace Street, London, SW1E 5JD, United Kingdom.

Polar Capital (Europe) SAS is authorised and regulated by the Autorité des marchés financiers (AMF) in France. Polar Capital (Europe) SAS’s registered address is 18 Rue de Londres, Paris 75009, France.

Polar Capital LLP is a registered Investment Advisor with the SEC. Polar Capital LLP is the investment manager and promoter of Polar Capital Funds plc – an open-ended investment company with variable capital and with segregated liability between its sub-funds – incorporated in Ireland, authorised by the Central Bank of Ireland and recognised by the FCA. Bridge Fund Management Limited acts as management company and is regulated by the Central Bank of Ireland. Registered Address: Percy Exchange, 8/34 Percy Place, Dublin 4, Ireland.

For UK investors: The Fund is recognised in the UK under the Overseas Funds Regime (OFR) but it is not a UK-authorised Fund. UK investors should be aware that they may not be able to refer a complaint against its Management Company or its Depositary to the UK’s Financial Ombudsman Service. Any claims for losses relating to the Management Company or the Depositary will not be covered by the Financial Services Compensation Scheme, in the event that either entity should become unable to meet its liabilities to investors. For information on the complaint process to the Management Company, please see the Country Supplement for this fund available at https://www.polarcapital.co.uk/.

Benchmark: The Fund is actively managed and uses the MSCI AC World Daily Total Return Net Health Care Index as a performance target and to calculate the performance fee. The benchmark has been chosen as it is generally considered to be representative of the investment universe in which the Fund invests. The performance of the Fund is likely to differ from the performance of the benchmark as the holdings, weightings and asset allocation will be different. Investors should carefully consider these differences when making comparisons. Further information about the benchmark can be found here. The benchmark is provided by an administrator on the European Securities and Markets Authority (ESMA) register of benchmarks which includes details of all authorised, registered, recognised and endorsed EU and third country benchmark administrators together with their national competent authorities.

Third-party Data: Some information contained herein has been obtained from third party sources and has not been independently verified by Polar Capital. Neither Polar Capital nor any other party involved in or related to compiling, computing or creating the data makes any express or implied warranties or representations with respect to such data (or the results to be obtained by the use thereof), and all such parties hereby expressly disclaim all warranties of originality, accuracy, completeness, merchantability or fitness for a particular purpose with respect to any data contained herein.

Country Specific Disclaimers: Please be aware that not every share class of every fund is available in all jurisdictions. When considering an investment into the Fund, you should make yourself aware of the relevant financial, legal and tax implications. Neither Polar Capital LLP nor Polar Capital Funds plc shall be liable for, and accept no liability for, the use or misuse of this document.